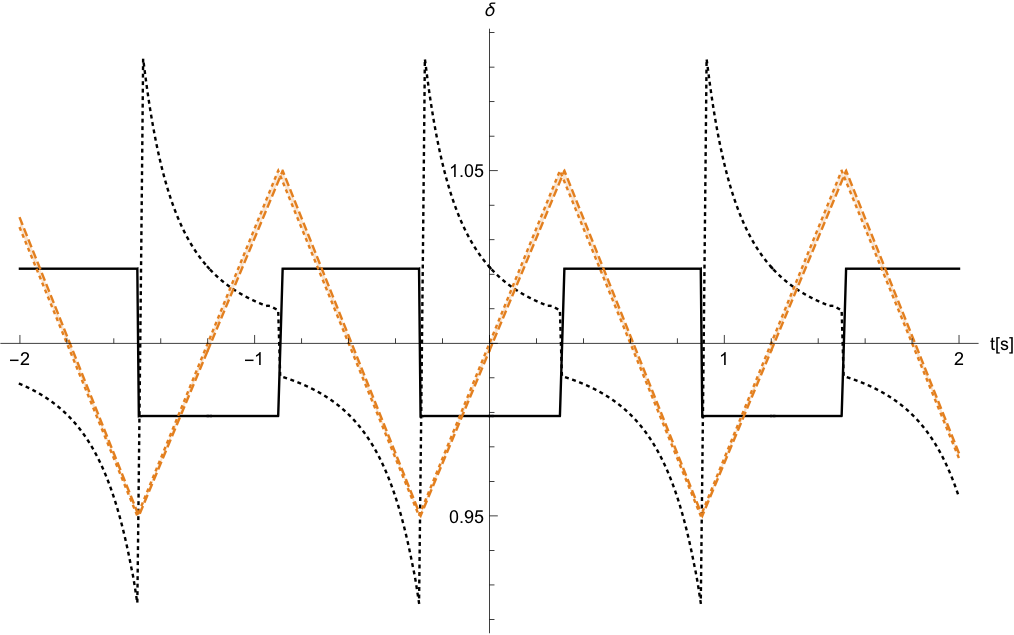
Fig 4: Black curve: pitch shift when modulating the period as in the Junos. Black dashed curve: pitch shift when modulating the clock frequency. Orange mess: the modulating waveform (arbitrary scale) and the same shifted with the sample line delay.
Fig 4: Black curve: pitch shift when modulating the period as in the Junos. Black dashed curve: pitch shift when modulating the clock frequency. Orange mess: the modulating waveform (arbitrary scale) and the same shifted with the sample line delay.